How to capture a SQL Profiler trace, and then export the results.
Procedure Steps
- Log into SQL Management Studio and select Tools > SQL Server Profiler.
- Log into the SQL Server database as a user with permission to perform a trace.
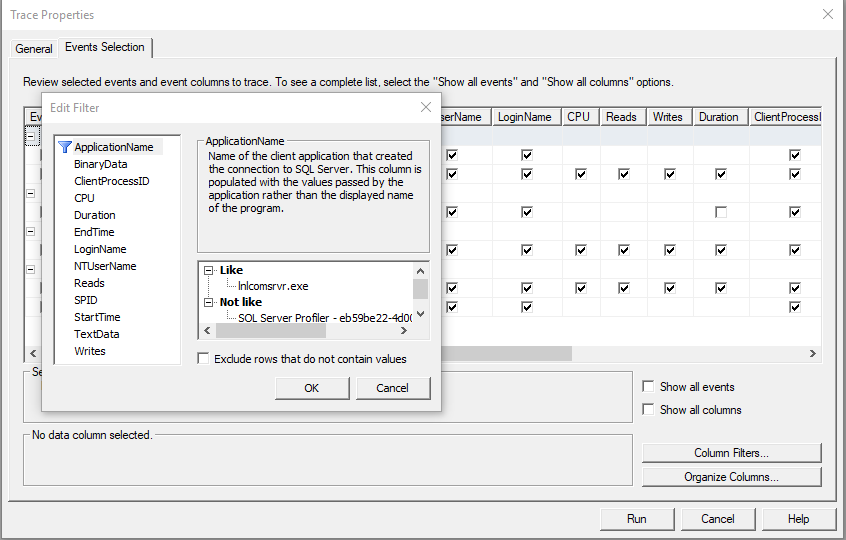
- Select the Events Selection tab and then click [Column Filters].
- Configure the filters to show what you want to see in the trace. Helpful items include ApplicationName, LoginName, and ClientProcessID. For example, if you want to capture traffic between the LS Communication Server and the database, you could use ApplicationName Like lnlcomsrvr.exe.
- Click [OK], then click [Run]. The trace starts.
- Reproduce the issue then stop the trace using the buttons at the top of SQL Profiler.
- Save the file as a Trace File for review and send the file to LenelS2 Technical Support Group.

Applies To
- SQL Management Studio
- SQL Server (all supported versions)
Additional Information
For additional information on permissions required to perform a SQL Profiler Trace, see the following Microsoft document:
© 2024 Honeywell International Inc. All Rights Reserved.